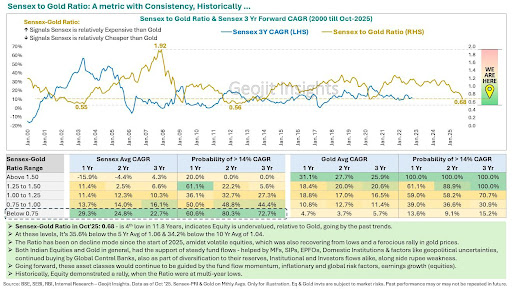
📊 Sensex to Gold Ratio – Understanding Market Trends (Data till Oct 2025)
The Sensex–Gold Ratio helps show how the equity market compares with gold over time. A high ratio means Sensex is relatively expensive, while a low ratio means Sensex is relatively cheaper versus gold.
As of October 2025, the Sensex–Gold Ratio is 0.68, one of the lowest levels in nearly 12 years. This is 35.6% below the 5-year average (1.06) and 34.2% below the 10-year average (1.04). The ratio has been declining since early 2025 due to equity volatility, recovery from previous lows, and strong gold prices. Both asset classes have seen support from global central bank buying, domestic investor participation, institutional flows, geopolitical factors, and rupee weakness.
Historical data (2000–2025) shows how Sensex and Gold delivered different CAGR levels across ratio ranges.
Lower ratio ranges often coincided with higher historical average returns for equities, while higher ratios often coincided with stronger gold performance. These figures reflect past trends and are not indicative of future outcomes.
The Sensex–Gold Ratio is a long-term metric used only for understanding historical patterns. Market performance is influenced by various economic and global factors.
Data Source: BSE, SEBI, RBI, Geojit Insights. For illustration only. Past performance may or may not be repeated.