Nifty Financial Services Valuation: Trading Below Historical Averages
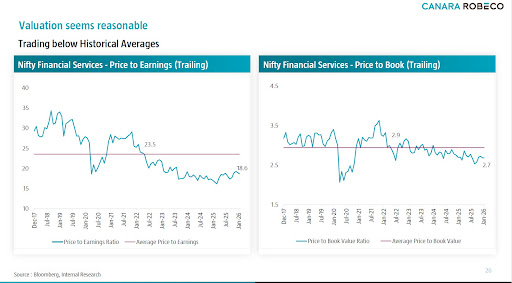
The chart indicates that Nifty Financial Services valuations are currently trading below their long-term historical averages, suggesting relatively reasonable pricing in the sector. As highlighted in both key valuation metrics — Price to Earnings (P/E) Ratio (Trailing) and Price to Book (P/B) Ratio (Trailing) reflect moderation compared to past peaks.
Price to Earnings (P/E) Ratio – Below Long-Term Average
The trailing P/E ratio is around 18.6, compared to the historical average of approximately 23.5. In previous market cycles, valuations crossed 30 during strong bull phases. The current lower P/E suggests improved earnings support and relatively comfortable valuations, which may indicate better risk-reward balance for long-term investors.
Price to Book (P/B) Ratio – Moderation in Valuations
The trailing P/B ratio stands near 2.7, versus its long-term average of about 2.9. Compared to earlier peaks above 3.5, current levels show valuation correction and normalization in the financial services sector.
What This Means for Investors
Lower P/E and P/B ratios historically signal more reasonable entry levels, especially when supported by earnings growth and sector fundamentals. The data suggests that the financial services space is not trading at overheated levels and remains aligned with sustainable valuation trends.
Source: Bloomberg, Internal Research.